
How to Add Local Generative AI to Grafana and Turn Charts into Decisions

Introduction: An AI That Helps You See Beyond
Grafana is one of the most widely used tools for real-time data visualization. You’ve probably faced the task of correctly interpreting a chart, especially if it’s not something you do every day. A local LLM (Large Language Model) can make the difference by turning visual information into clear, actionable explanations.
Imagine you have a dashboard with multiple metrics and you spot an anomaly in a chart: an LLM can help you understand what’s happening and suggest possible causes or actions.
In this guide, we’ll show you how to integrate a local LLM into Grafana so it can interpret charts in real time and help users make more informed decisions. We’ll replace API calls to ChatGPT with a local service running on ollama with the LLM of your choice.
In this example, we’ll use Moondream, which at only 1.8B parameters is pretty basic and small, but it’s a placeholder you can swap out depending on the compute power you have available.
How Does It Work?
The process requires bringing two worlds together: visualization and Generative AI. It’s based on the following steps:
- Chart data capture: Relevant data is extracted from the Grafana panel.
- LLM processing: The information is sent to a local language model for analysis.
- Insight generation: The LLM returns a summary/analysis/comparison in natural language.
- Grafana visualization: The generated results are displayed alongside the original chart.
1. Download the Repo and the Data
First, download the repo and navigate to the folder where the plugin we’re going to install lives.
Then, spin up the Grafana containers and the database that holds the data to chart:
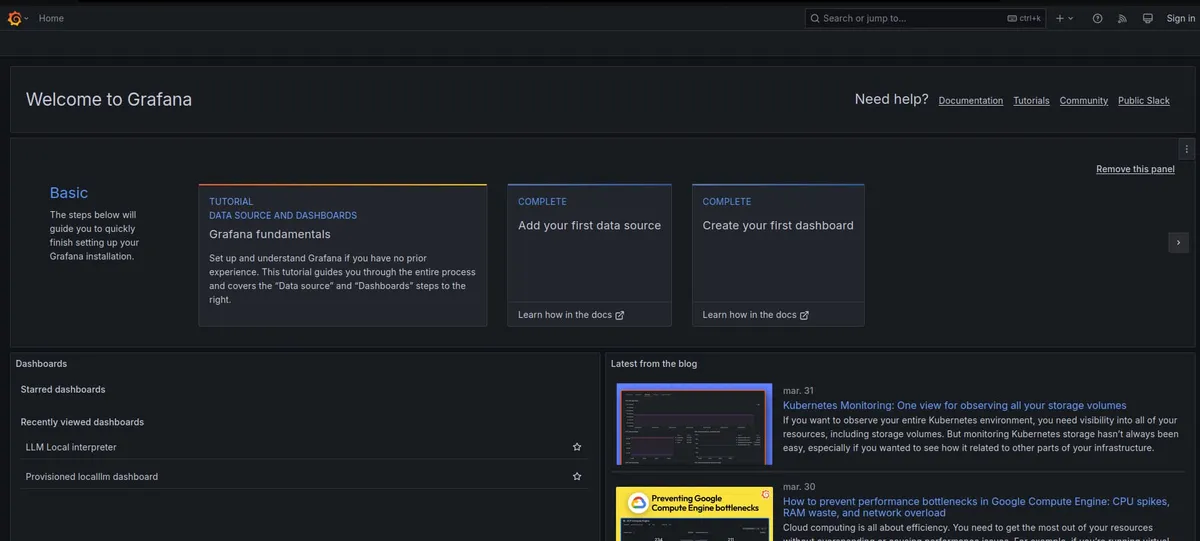
If you go to localhost:3000, you’ll find that Grafana is up and running.
You have two different ways to pull in the data.
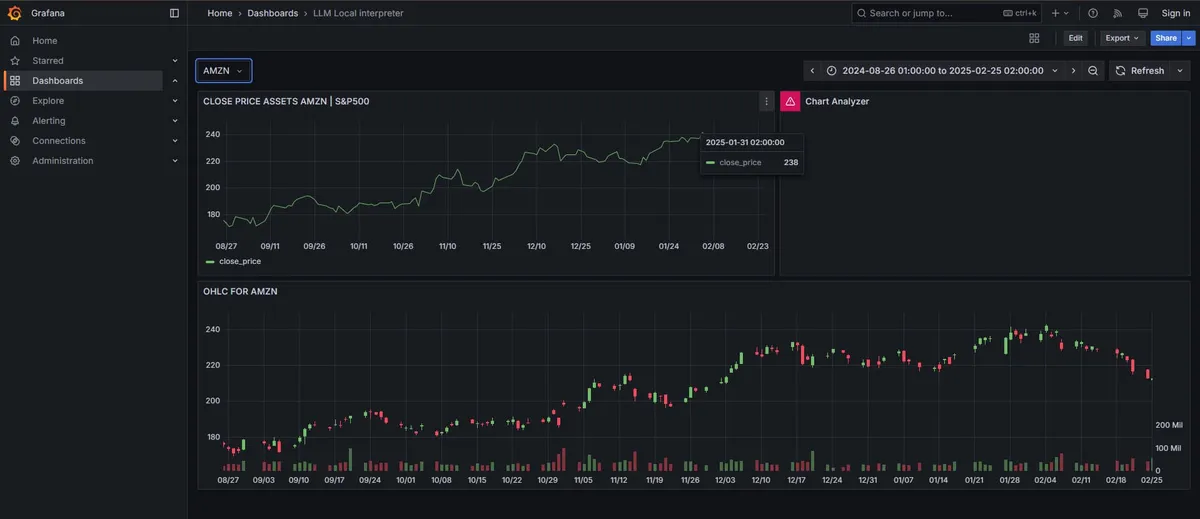
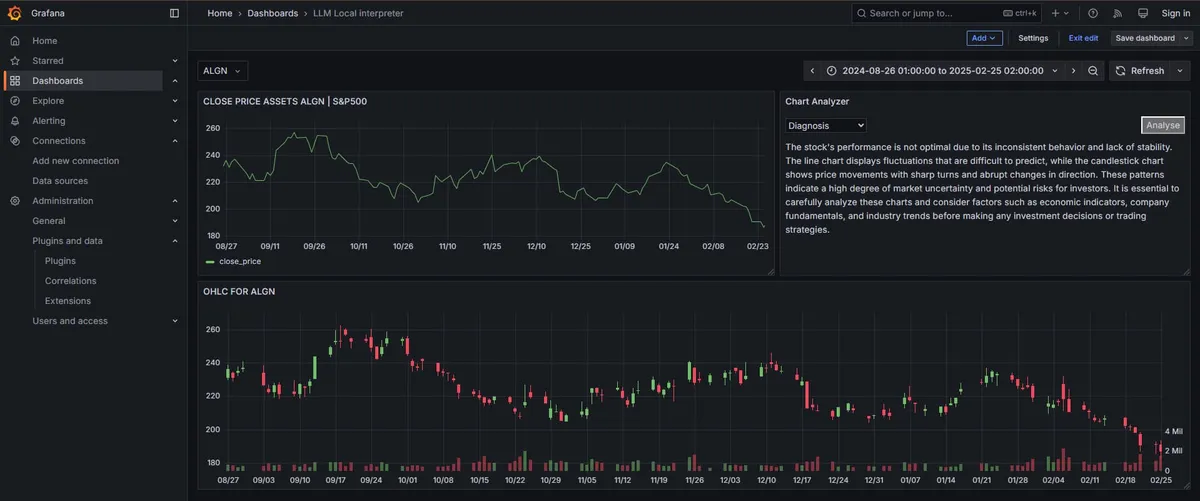
With that done, you’ll see that in Grafana we can now access the dashboard showing all S&P 500 stocks over a time range.
2. Install the Chart Analyzer
The Chart Analyzer is still empty because we need to install the panel using its dependencies, and for that we need Node.js.
Node.js is a runtime that lets you execute JavaScript code outside the browser, directly on your computer. Although JavaScript was born for making interactive web pages, with Node.js it can now also be used to create programs, servers, automations, and development tools. Node has become very popular because it’s fast, lightweight, and has a huge community that shares reusable code packages through a system called NPM.
In this Grafana plugin, we use Node.js to handle the entire development environment: installing dependencies, running the plugin in test mode, checking for errors, and packaging the plugin for production. You don’t need to know how to program in depth to get started; you simply install the necessary tools and run basic terminal commands like npm install or npm run dev to make everything work.
With that clarification out of the way, let’s install the panel.
In the repo root, we’ll install dependencies and run the plugin.
If this step gives you an error, it’s because the folder permissions need to be modified, so go back one step and run this.
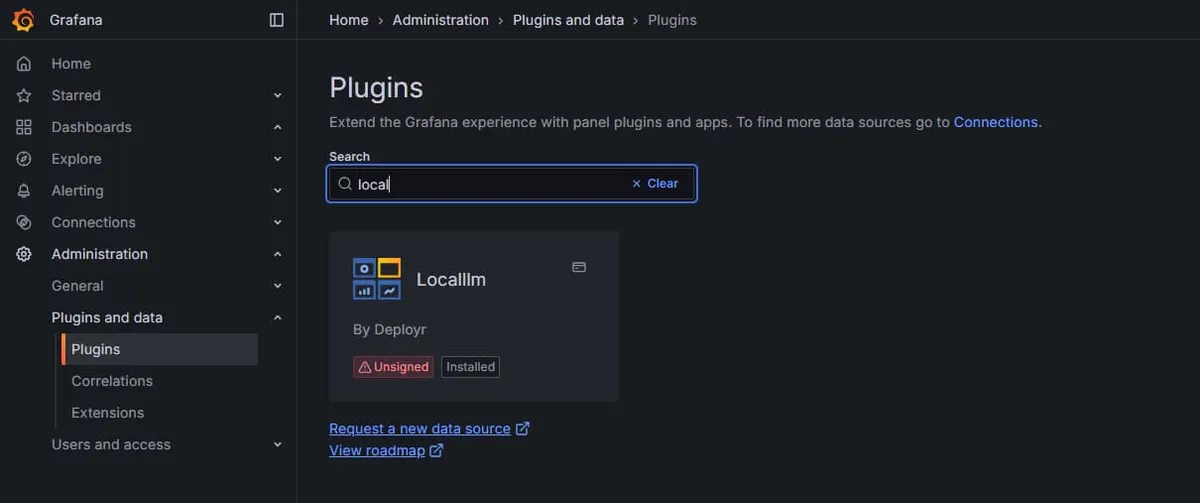
With that done, go back to the folder and install everything. Now restart the containers and you’ll see that the panel is now installed in Grafana.
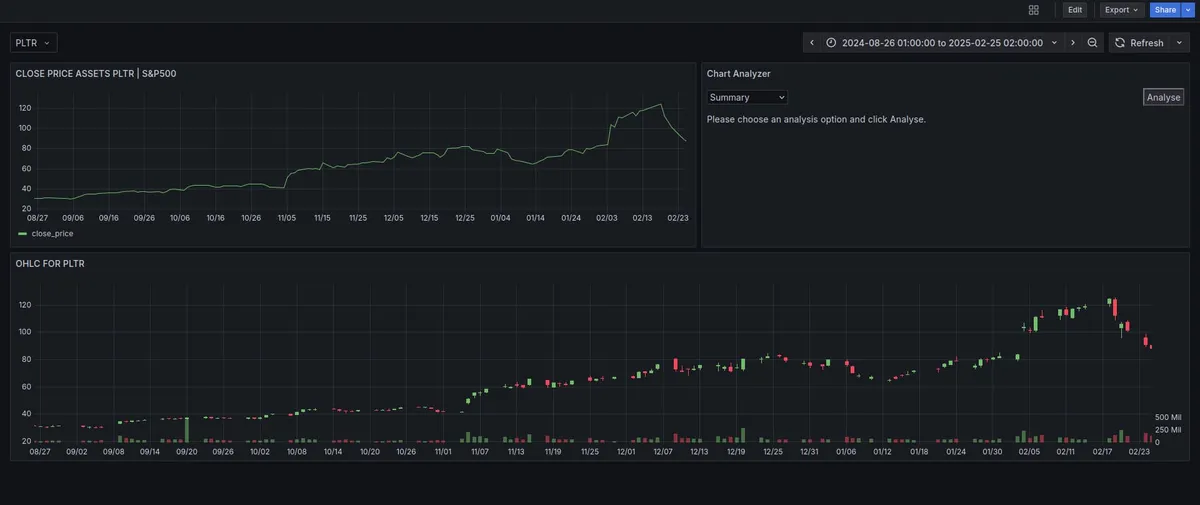
You’ll notice that the dashboard now has the panel we just installed enabled, in the upper right corner.
3. Run the Plugin
The plugin lets the user select different types of analysis depending on the chart displayed. Some of the options include:
- Trend analysis: Detects increasing or decreasing patterns over time.
- Anomaly detection: Identifies spikes or outlier values.
- Historical comparison: Contrasts the current chart with similar previous periods.
Each of these options derives from a prompt to the LLM, which you can edit to your liking in the code. Hovering over the panel, you’ll see three dots in the upper right corner. Clicking them lets you also edit the dashboard parameters, such as which LLM you’re calling.
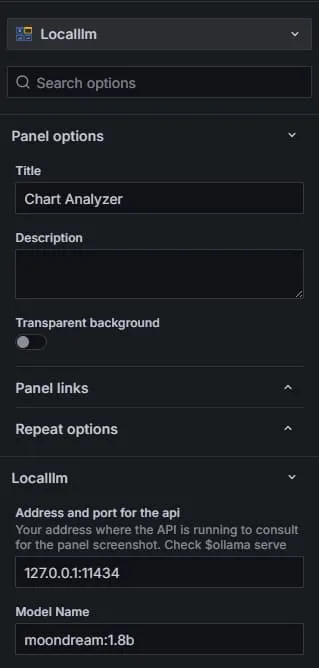
In this case, the port is the one used by Ollama, the popular library for deploying and serving LLMs locally. If you don’t have it installed, it downloads in just one command, and with one more you can pull the model we’ll use.
With the model running, we’re ready to tell the LLM to interpret what it sees.
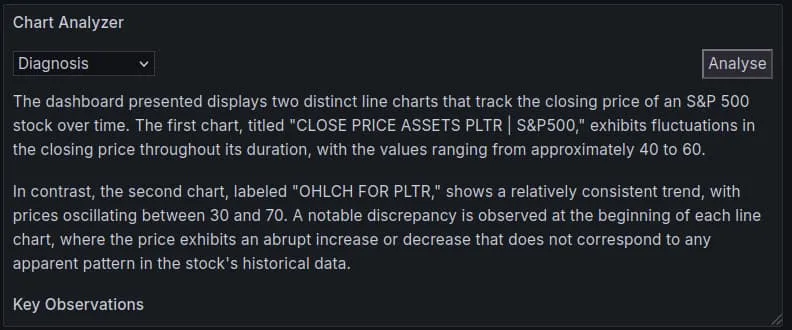
The result you see here is from a run where we queried Llama-3.2-vision, which is quite a bit more powerful than good old Moondream.
With Moondream as the placeholder, the complete application should look like this.
Conclusion: Visualization Alone Isn’t Enough Anymore
While Grafana already lets you visualize data powerfully, combining it with AI adds an extra layer of intelligence. Implementing it is an accessible and highly beneficial process, especially in environments where speed of decision-making is critical.
On the other hand, a local implementation adds an extra layer of security: it ensures your data stays off the network, and that speed and accuracy depend on the hardware you have and the LLM you choose to use.
Start improving your dashboards today with automated analysis. If you need help incorporating these tools into your organization, reach out.


