
An introduction to Data Quality tools in Python

Introduction
Recently, I worked on a Data Engineering project to build a Data Warehouse architecture, ingesting CSV data from multiple sources. We had the opportunity to implement Data Quality controls in multiple ETL pipelines. There are several Python-based data quality tools available to achieve this goal.
In this article, I want to review fundamental Data Quality concepts and share two of these tools, specifically Great Expectations and PyDeequ, which we considered for implementing controls. I’ll show some advantages and disadvantages we observed in each one, to help you if it’s the first time you’re implementing this functionality.
Why Data Quality?
Neglecting data quality can have a series of negative consequences that affect your organization’s performance, reputation, and competitiveness. If there’s no good-quality data, analyses and decisions can be inaccurate. Stakeholders might make decisions based on outdated or incorrect information, which could lead to bad calls and potentially costly mistakes. When the source of data errors is identified, trust in the data and the teams responsible for it inevitably erodes. Moreover, if data is shared outside the organization and there are Data Quality issues, external users can also lose confidence, damaging the organization’s reputation.
Additionally, working with low-quality data can lead to incorrect perceptions and a loss of focus on the true value of information, causing data teams to waste time hunting down error sources. Looking at it positively: ensuring data quality means your organization’s decisions will be well-informed and up-to-date, avoiding costs associated with bad decisions and improving your company’s competitiveness.
What aspects of Data Quality do we typically evaluate?
-
Accuracy: Data accuracy measures how well the data reflects the real-world entities it represents. Accurate data is free from errors and inconsistencies.
-
Completeness: Completeness evaluates whether all necessary data is present. It ensures that no critical information is missing from the datasets.
-
Timeliness: Timeliness refers to the freshness of the data. It measures how up-to-date the data is and whether it meets the required deadlines for analysis and decision-making.
-
Uniqueness: Uniqueness ensures there are no duplicate records in the dataset.
-
Validity: Validity checks whether data complies with predefined rules and constraints; it ensures data is in the expected format and meets quality standards.
-
Consistency: Consistency evaluates the uniformity of data across different sources and systems. Inconsistent data can lead to confusion and inaccuracies.
-
Fitness for Purpose: Data must be fit for its intended purpose. This means the data should be relevant and suitable for specific tasks and analyses.
Key features of Data Quality tools
Some of the key features of Data Quality tools you can use to choose the one most convenient for you include:
-
Data Validation: An essential element of Data Quality tools is the ability to verify that certain “rules” are met in the data we want to analyze. This includes checking whether column values fall within specific ranges, whether there are no null values in a column, whether statistical values like averages and standard deviations fall within predefined limits, among other validations.
-
Profiling / Automatic Validation Rule Suggestion: Another important feature is the ability to automatically analyze a sample of the data we want to process. This allows extracting general data characteristics, identifying variable ranges, determining variable types, detecting missing values, and identifying distribution patterns. Based on this information (profiling), tools can suggest possible Data Quality validations and rules to apply.
-
Anomaly Detection: Based on the profile or behavior of columns in our dataset, these tools can propose alerts that detect if any data-related metric, such as the mean or standard deviation, falls outside predefined limits and deviates significantly from what’s expected. This function is essential for identifying outlier or unusual data that could indicate data quality issues or problems in the data acquisition process.
-
Report Generation: Some Data Quality tools can generate interactive visualizations, detailed reports, or executive summaries that synthesize the results of dataset analysis and applied validations. These reports help users understand Data Quality and key findings clearly and concisely, facilitating informed decision-making and communicating results to stakeholders.
-
Failed Record Recovery: When validations aren’t met, some Data Quality tools allow developers to identify specific records that contain errors, which can be flagged and prioritized for review and action. This helps maintain data integrity and ensures issues are addressed promptly.
-
Integrations: Many Data Quality tools offer various options for connecting to other data sources, process orchestration systems, or for sending results to various destinations. These integrations facilitate workflow automation, incorporation of external data, and efficient distribution of analysis results across different channels and systems, improving the effectiveness of Data Quality operations.
PyDeequ
Description
PyDeequ is a data validation library originally designed in Scala and later adapted for Python. This tool provides capabilities for anomaly detection, profiling, and Data Quality control suggestion. PyDeequ integrates with the Spark ecosystem, enabling efficient management of large datasets.
In PyDeequ, the constraint suggestion functionality lets you analyze a sample of the data to quickly obtain Data Quality conditions that will be applied to each column. These constraints can then be copied and incorporated into a set of chained checks for use on the rest of the data to process. Constraints also let you specify a percentage threshold at which an error or warning should trigger via lambda functions. You can also specify hints to quickly identify constraints when results are delivered.
Additionally, PyDeequ provides several analyzers that serve as measures of specific dataset characteristics, such as dataset size, standard deviation, percentage of unique values, pattern matching defined by regular expressions, etc. These analyzers can be used to detect anomalies based on a reference dataset by setting thresholds. If analyzer values vary between datasets beyond a certain proportion defined by the thresholds, this is reported.
Quick Start Guide
- Generate a sample dataset (you can run this code in your working directory and the data will be generated at Example_Data/Batches/Example_batch0.csv):
from faker import Faker
import pandas as pd
import random

fake = Faker(seed=123)

num_rows = 1000

data = {
    "Name": [fake.name() for _ in range(num_rows)],
    "Email": [fake.email() for _ in range(num_rows)],
    "Phone": [fake.phone_number() for _ in range(num_rows)],
    "Address": [fake.address() for _ in range(num_rows)],
    "Date of Birth": [fake.date_of_birth(minimum_age=18, maximum_age=80).strftime("%Y-%m-%d") for _ in range(num_rows)],
    "Salary": [fake.random_int(min=30000, max=100000) for _ in range(num_rows)],
    "Department": [fake.random_element(elements=("HR", "IT", "Finance", "Sales", "Marketing")) for _ in range(num_rows)],
    "Hire Date": [fake.date_this_century().strftime("%Y-%m-%d") for _ in range(num_rows)],
    "Employee ID": [fake.unique.random_number() for _ in range(num_rows)],
    "Vacation_Days": [fake.random_int(min=0, max=30) if random.random() > 0.1 else None for _ in range(num_rows)]
}

# Introduce null values in some columns
for i in range(100):
    data["Email"][random.randint(0, num_rows - 1)] = None
    data["Salary"][random.randint(0, num_rows - 1)] = None

# Replace some values in the "Department" column with rare values
for i in range(50):
    data["Department"][random.randint(0, num_rows - 1)] = fake.random_element(
        elements=("Legal", "R&D", "Customer Support")
    )

df = pd.DataFrame(data) # Create a DataFrame from the generated data

output_folder = "Example_Data/Batches/"
os.makedirs(output_folder, exist_ok=True)

split_dfs = np.array_split(df, 3)  # Split the DataFrame

for i, split_df in enumerate(split_dfs):
    file_name = f"{output_folder}Example_batch{i}.csv"
split_df.to_csv(file_name, sep=",", index=False)- Load the sample dataset and create a Spark session.
import pandas as pd
from pyspark.sql import SparkSession
import sagemaker_pyspark
import pydeequ

df = pd.read_csv('Example_Data/Batches/Example_batch0.csv')

classpath = ":".join(sagemaker_pyspark.classpath_jars())

spark = (SparkSession.builder
	.config("spark.driver.extraClassPath", classpath)
	.config("spark.jars.packages", pydeequ.deequ_maven_coord)
	.config("spark.jars.excludes", pydeequ.f2j_maven_coord)
	.getOrCreate()
)- Run the constraint suggestion command.
from pydeequ.suggestions import *

suggestionResult = ConstraintSuggestionRunner(spark) \
	.onData(df) \
	.addConstraintRule(DEFAULT()) \
.run()- You can display the suggested constraints:
for sugg in suggestionResult['constraint_suggestions']:
	print(f"Constraint suggestion for '{sugg['column_name']}': {sugg['description']}")

for sugg in suggestionResult['constraint_suggestions']:
print(f"{sugg['code_for_constraint']}")- Load a new batch of data:
df = pd.read_csv('Example_Data/Batches/Example_batch1.csv')
df.columns- Create a check:
from pydeequ.checks import *
from pydeequ.verification import *

check = Check(spark, CheckLevel.Error, "Integrity checks")- Add the suggested constraints to the check, forming a “verification suite,” and run it:
checkResult = VerificationSuite(spark) \
.onData(df) \
.addCheck(
check.hasSize(lambda x: x <= 300_000) \
	.isContainedIn("Department", ["Marketing", "HR", "Finance", "IT", "Sales"])
	.isComplete("Department")
	.isComplete("Name")
	.isUnique("Name")
	.isComplete("Address")
	.isUnique("Address")
	.isComplete("Hire_Date")
	.isUnique("Hire_Date")
	.isComplete("Vacation_Days")
	.isNonNegative("Vacation_Days")
	.isComplete("Date_of_Birth")
	.isComplete("Email")
	.isUnique("Email")
	.isComplete("Phone")
	.isComplete("Salary")
	.isNonNegative("Salary")
	.isComplete("Employee_ID")
	.isNonNegative("Employee_ID")
	.isUnique("Employee_ID")
).run()- Convert the results to a Pandas dataframe and display them:
checkResult_df = VerificationResult.checkResultsAsDataFrame(spark, checkResult)
checkResult_df.toPandas().head(10)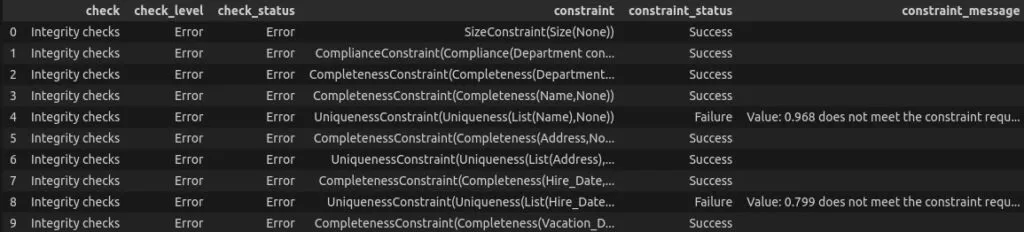
Be careful not to use spaces in column names or have typos in them, as this can lead to error messages in many of the conditions. I’ll demonstrate this error by running the “verification suite” again, but removing the underscore from “Employee_ID” in the line with the .isNonNegative(“Employee_ID”) check. The result is:
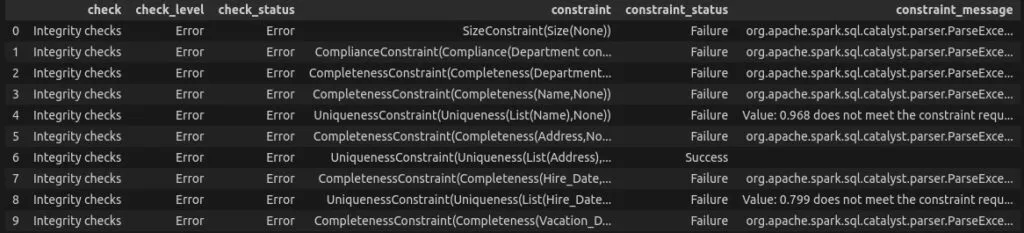
Additional comments:
-
A unique feature of PyDeequ is the “satisfies” constraint, which lets you define conditions in SQL language for columns. This is especially useful for validating that data meets logical conditions composed of multiple simpler conditions.
-
It’s important to note that, unlike some other tools, PyDeequ doesn’t generate reports; it delivers results in a dataframe, and the user is responsible for implementing the functionality to access the data and incorporate it into a report.
Great Expectations
Description:
Great Expectations is an open-source Python-based tool backed by a large community. This project has successfully integrated with a wide variety of data sources and tools, making it a versatile choice for Data Quality management.
In Great Expectations, Data Quality rules are structured as “expectations.” These expectations are defined “positively,” meaning they specify the conditions data should meet. If data doesn’t meet these conditions, the expectation returns an alert, flagging a potential Data Quality issue.
This approach allows data professionals to articulate and enforce Data Quality requirements in a clear and practical way. For example, you can establish expectations that data columns must comply with specific data types, ranges, or value constraints. If data deviates from these expectations, Great Expectations will generate the corresponding alerts.
Additionally, Great Expectations offers other features including data profiling, automatic validation, continuous monitoring, and integration with various data platforms. It particularly stands out by providing good data documentation, offering valuable insights into data distributions and summary statistics. This documentation not only improves data transparency but also facilitates collaboration between data teams.
While Great Expectations offers many advantages, users should keep a close eye on its documentation, as frequent updates can introduce changes and variations between versions. Also, expressing complex logical conditions directly through expectations can become somewhat involved. However, the tool provides the flexibility to work with “row conditions” to handle more intricate logic.
Let’s look at some commands to understand the key functionalities of this tool.
Quick Start Guide
To get started, in a Conda environment with Python, you can install Great Expectations using pip with the following command:
pip install great_expectations
pip install great_expectations_experimental
Personally, I recommend starting with the Great Expectations command-line interface (CLI) to perform the initial project configurations. This tool guides you step by step through defining data sources and the validations you want to perform, and automatically creates notebooks with the necessary code to implement them. With that code, you can later make changes to fully determine the operations and get validation results in the expected format.
To develop a project using the CLI, create an empty directory and activate the Conda environment where Great Expectations was installed. From there, use the following commands.
great_expectations init
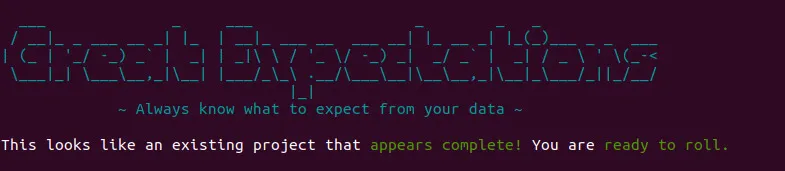
great_expectations init creates a directory structure for Great Expectations, where datasources pointing to the data you want to process, validation rules to apply, notebooks generated by the wizard, and HTML reports from analyses will be stored.
Next, running great_expectations datasource new specifies where the dataset to process will come from. Options include File System and a SQL server. If you select File System, you’ll need to determine whether the engine is Spark or Pandas and specify the directory where the files to process are located (all shown in the image below).
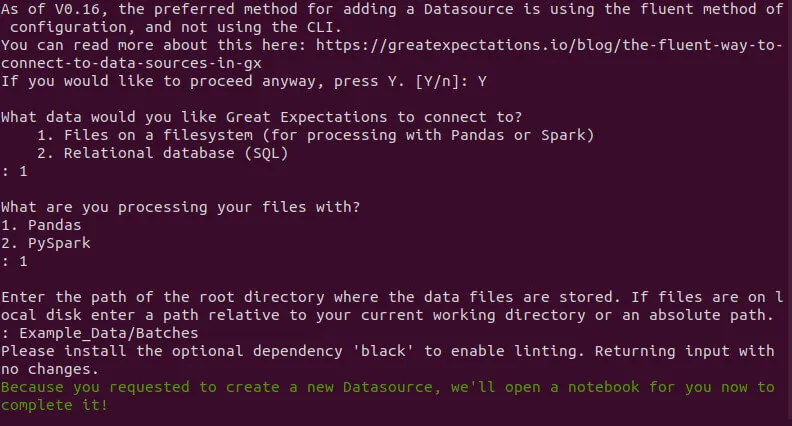
Once you confirm the previous steps, the wizard will open a Jupyter notebook that must be fully executed for the configurations to take effect. The notebook is located in the project directory and you can choose to delete or keep it for future configuration changes.
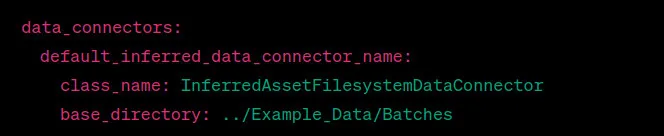
In the Jupyter notebook, review the yaml configuration string for the Datasource. In the “data_connectors” field, the first lines should contain information like:
The next command is great_expectations suite new, which creates a new expectation suite. The wizard offers 3 options:
-
Create the suite manually
-
Create the suite from a data asset
-
Create the suite with the wizard.
If it’s your first time using Great Expectations, I recommend option 3, since the first two require knowledge of available expectations and domain knowledge to determine what validations your data needs. If you selected option 3, you can choose a file from the previously configured data directory to infer the table schema and the validations that could apply.
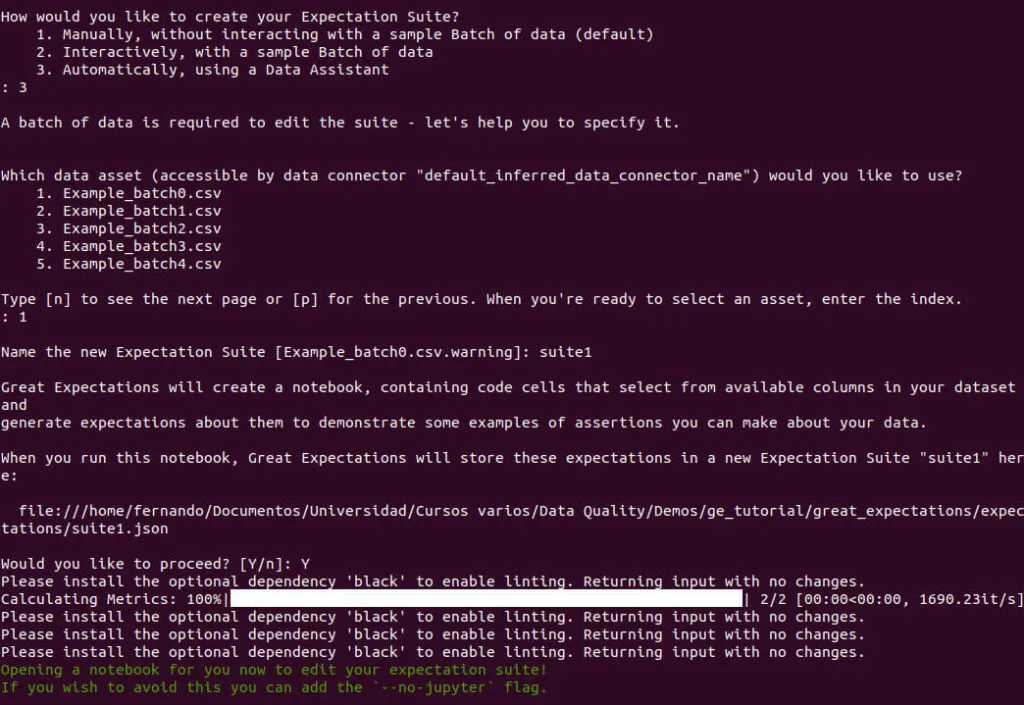
When you select the file for schema inference, you’ll be asked to assign a name to the new suite and confirm your final selection. After that, a notebook opens that you need to run so Great Expectations suggests the expectations applicable to your specified dataset. Execute all cells in the notebook, and a new browser tab will open with an HTML report describing the generated expectations for the suite.
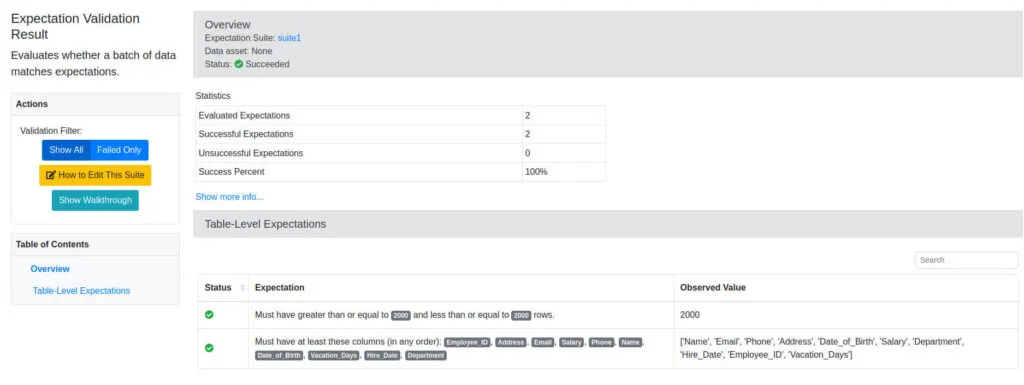
These expectations can be found in the project directory at great_expectations/expectations/<suite_name>.json. You can modify this file by adding or removing expectations. The catalog of available expectations, along with their development status, can be found at https://greatexpectations.io/expectations/.
Running great_expectations checkpoint new <checkpoint_name> opens a notebook that lets you configure the checkpoint. In this notebook, many configurations based on the datasource and expectations suite from previous steps are listed. It also allows setting additional configurations. For example, you can choose a different file from the original to apply expectations to. Additionally, with extra code, you can specify that expectations be applied to multiple files whose names match a certain regular expression (multi-batch request).
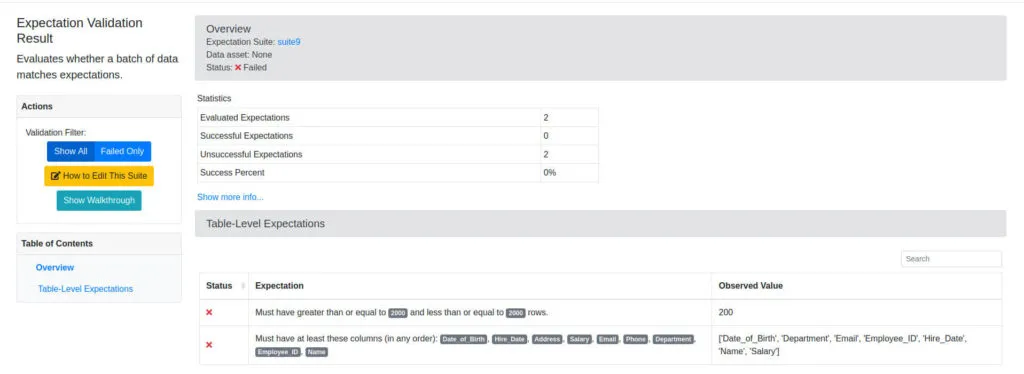
The last cell in the notebook contains commented-out code lines that, when executed, apply the checkpoint and display results in an HTML report in a new browser tab. If we use a batch of data missing a column and with missing rows, we should see a report like the one shown below:
Created checkpoints are stored in the project directory at:
great_expectations/checkpoints/<checkpoint_name>.yml
Checkpoint results can be found in the project directory in JSON format at:
great_expectations/uncommitted/validations/<suite_name>/<time_stamp>/<time_stamp>/<random_hash_name>.jsonor as HTML reports at:
great_expectations/uncommitted/data_docs/local_site/validations/<suite_name>/<time_stamp>/<time_stamp>/<random_hash_name>.HTMLFinally, with great_expectations checkpoint run <checkpoint_name> you can apply the checkpoint through the CLI.
Additional comments:
-
I recommend looking into the multi-batch requests workflow.
-
Among the integrations available in Great Expectations, I want to highlight the following:
Conclusion
In this article, we covered the fundamentals of Data Quality and introduced two Python-based tools for performing data quality analysis. PyDeequ takes a somewhat simpler and more direct approach to applying controls, while Great Expectations offers very useful features for somewhat larger-scale projects. If you’re interested in learning more about these tools, leave your questions in the comments.


